Automatic tumor segmentation for GTV and CTV, with direct radiation dose calculation from MRI and CT images.
Project Leaders
Junqiang Ma

Project Leaders
Junqiang Ma
Project Leaders
Junqiang Ma
Project Example

Project Leaders
Junqiang Ma
Project Example

Project Leaders
Junqiang Ma
Project Example

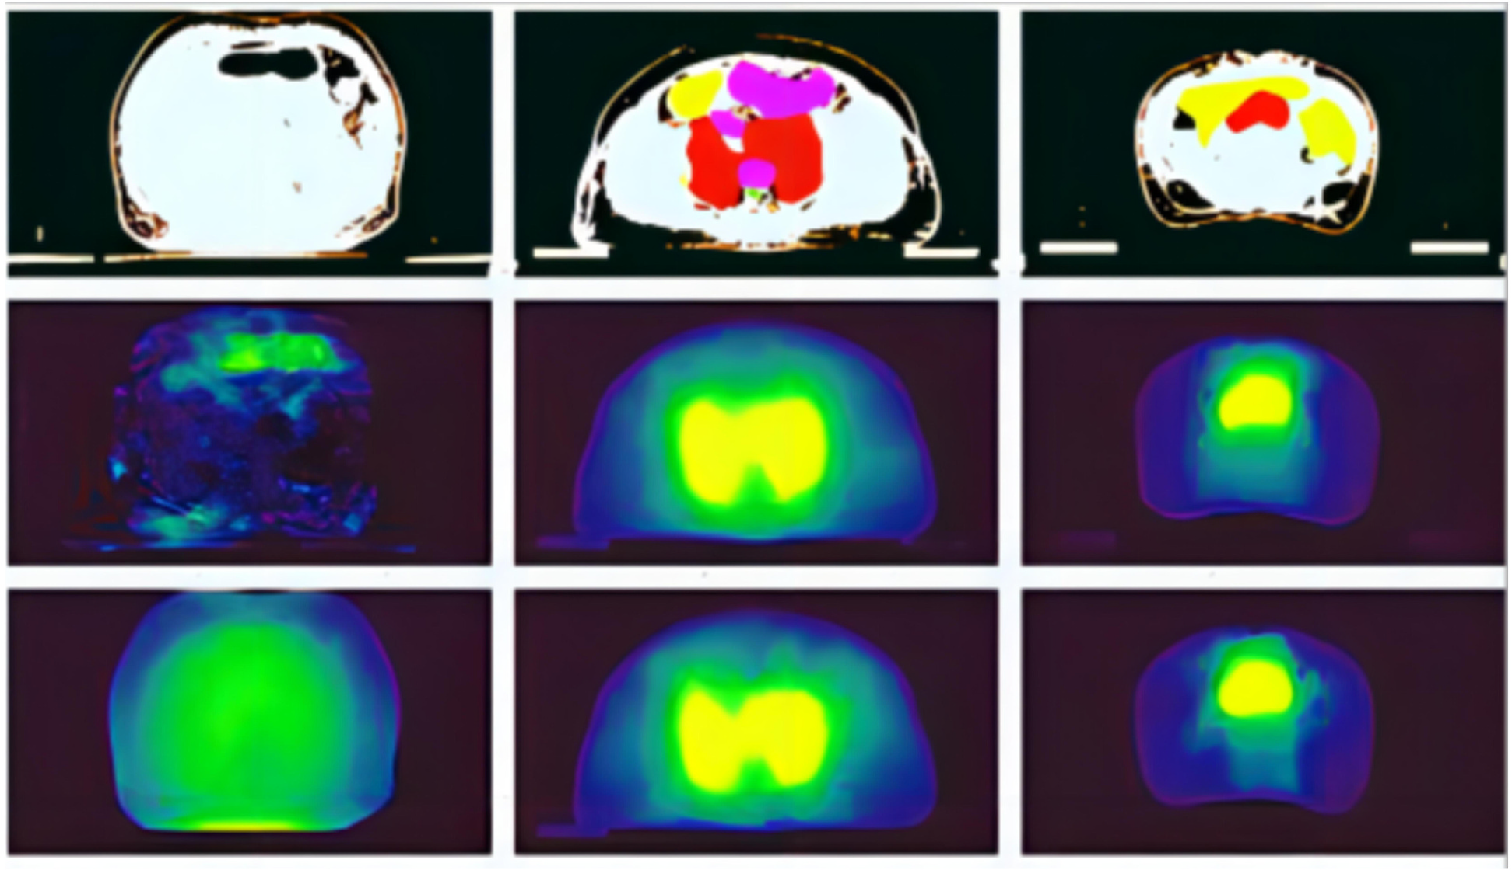
Fig. 1 Comparison examples of predicted and true dose; the plot was obtained by random sampling; the first line: CT images; the second line: the true dose map; the third line: the predicted dose map.
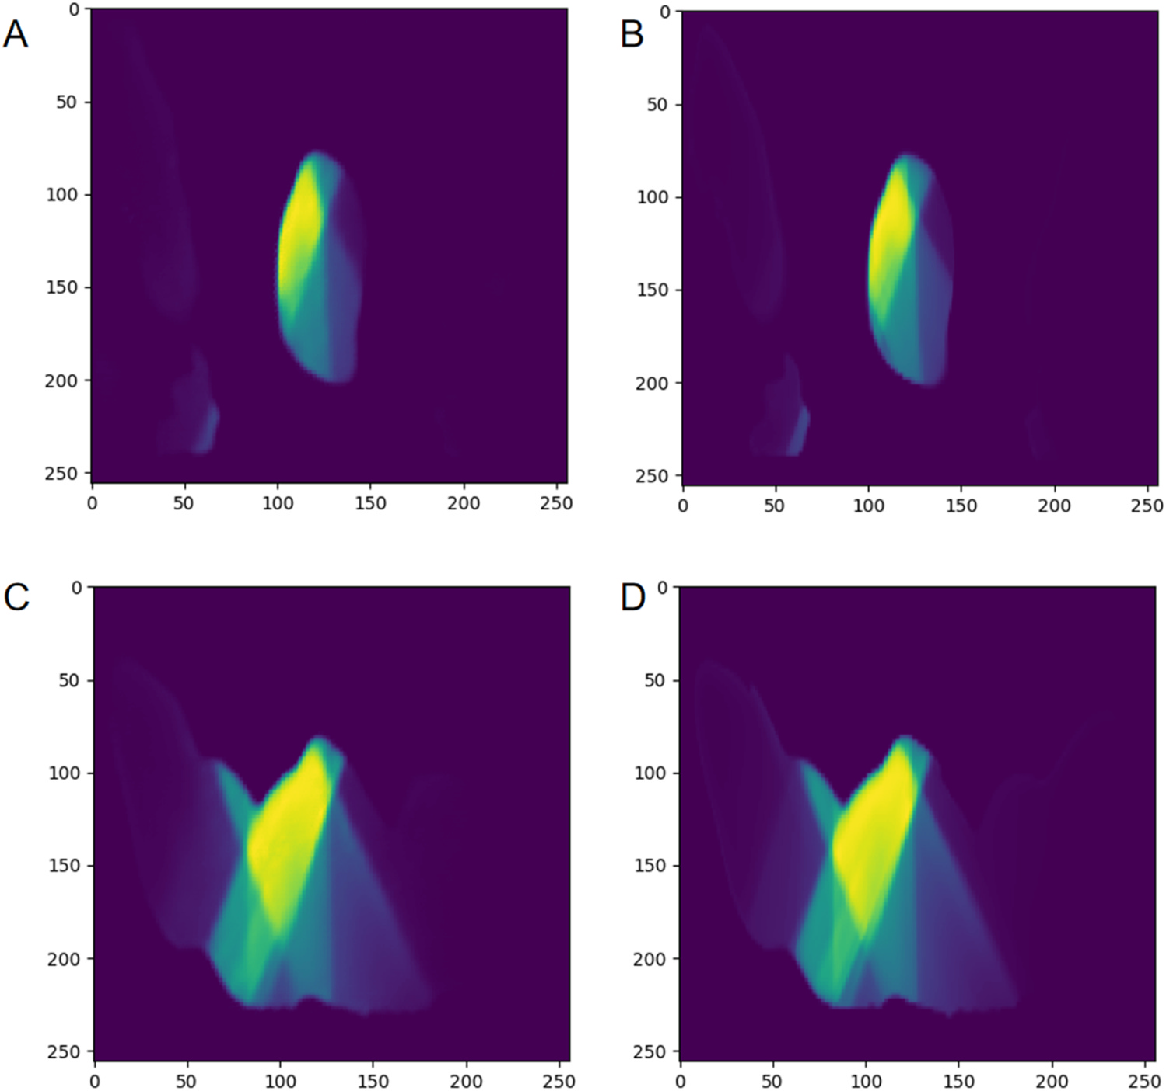
Fig. 2 Comparison of predicted dose and original dose in two cases. The left side (A, C) are the predicted dose image, and the right side (B, D)is the original dose image.
Project Leaders
Hui Xie
Partner Organisations
湘南学院附属医院
Project Example

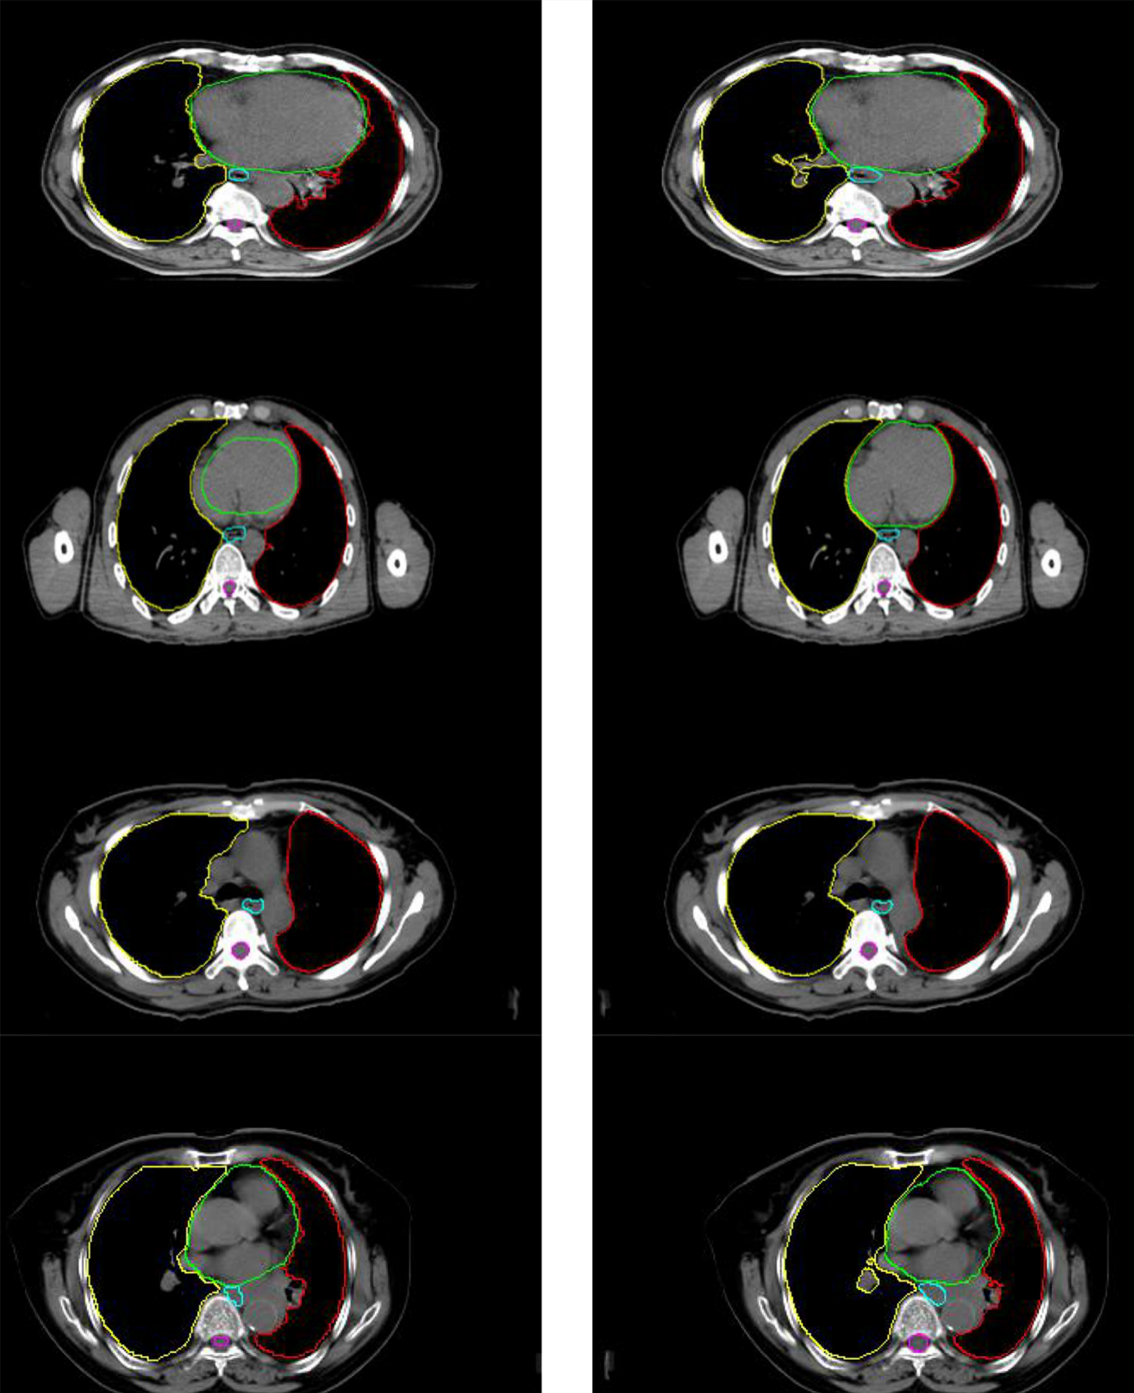
The comparison between the automated segmentation delineation of some test cases and the manual delineation results of the radiologist. In the figure, each horizontal line lists a comparison of different test cases. The left side is delineated by physicians and the right side by the D-FCN4s model automatically.